Ethereum rebounds as US-Iran de-escalation hopes push oil and bond yields lower
Optimism over US-Iran negotiations has cooled oil prices and bond yields, sparking a brief crypto rebound. Ethereum rebounds to $2,125 but remains structurally weak, trading below its 200-day SMA. While lower geopolitical uncertainty favours risky assets, global central banks face persistent inflation risks, complicating long-term market momentum amidst ongoing economic uncertainty.

Hopes for a US-Iran resolution pushed 10Y yields down to 4.58% and Brent crude to $105.02, easing immediate market tension.
Ethereum edged up to $2,125 on renewed risk appetite, yet it faces a structural challenge under its critical 200-day SMA line.
Despite short-term oil relief, central banks face sticky inflation that could sustain a prolonged higher-for-longer rate stance.
Ethereum rebounds as US-Iran optimism weighs on oil and yields
Global oil prices and US Treasury yields decreased sharply amid rising hopes of a conflict resolution between the United States and Iran. According to reports from Reuters, US President Donald Trump stated that negotiations with Tehran were in their final stages. In response to the news, the benchmark US 10-year Treasury yield fell by 8.2 basis points to settle at 4.58%, while the Brent crude futures contract (BRNN6) depreciated by 5.63% to close at $105.02 per barrel. However, Iranian officials have yet to comment publicly on a potential resolution.
Geopolitical contexts characterized by lower systemic uncertainty tend to drive cryptocurrency valuations, as investors rotate capital back into higher-beta risk assets in pursuit of a superior return premium. Reflecting this shift in sentiment, Ethereum appreciated by 0.96% to close at $2,125. Nevertheless, the digital asset continues to face a challenging technical landscape. Price action is currently testing a relevant support area, while short-term momentum indicators signal underlying selling pressure and the persistent threat of a deeper market correction.
Furthermore, while a successful diplomatic resolution in the Middle East could depress energy prices in the short term, global central banks remain confronted by sticky inflation. These persistent price pressures imply that policymakers may be pressured to maintain higher interest rates or execute a more prolonged "higher-for-longer" monetary policy regime. Such macro conditions could ultimately dampen momentum for risky assets if the complex economic environment deteriorates further.
Technical analysis of Ethereum
From a technical standpoint, Ethereum is currently navigating a consolidation pattern that denotes significant market uncertainty. A detailed breakdown of the current market structure reveals several key observations:
- Trend Context: Within a long-term framework, Ethereum continues to trade beneath its 200-day Simple Moving Average (SMA), a positioning that reinforces the prevailing bearish sentiment. In the short term, price action is confined to a tight triangular range that has persisted for approximately three months, reflecting a broader state of market indecision.
- Resistance Levels: Should immediate overhead resistance near $2,400 be breached to the upside, the primary technical ceiling is identified at $2,550, which converges with the declining 200-day SMA. Reclaiming this structural benchmark is considered a necessary prerequisite for re-establishing a sustained bullish trajectory.
- Support Levels: If the immediate psychological support at $2,000 is compromised, the next critical floor resides at the $1,800 mark—a vital structural support. A sustained close beneath this threshold would likely intensify selling pressure and heighten the probability of a more profound market correction.
- Momentum Indicators: The Moving Average Convergence Divergence (MACD) indicator is currently crossing below the zero line, suggesting that downward momentum could capture further territory. Conversely, the Relative Strength Index (RSI) is approaching the oversold threshold, indicating a need for near-term caution.
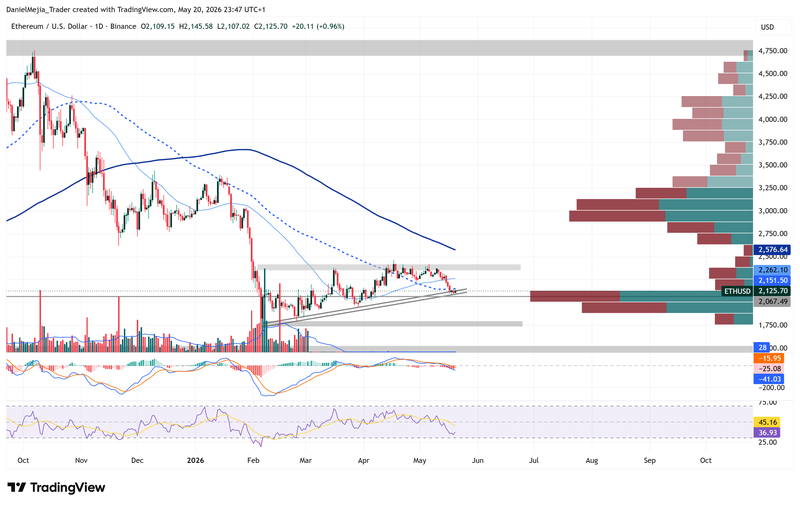
Figure 1. Ethereum Prices (2025–2026). Source: Data from the Binance Exchange; Own analysis conducted via TradingView.


