Ethereum retreats as markets turn risk-off on inflation fears
Ethereum is currently testing a pivotal support zone as mounting inflation anxieties and surging US Treasury yields prompt investors to reallocate capital into defensive assets. Trading below its 200-day Simple Moving Average (SMA), the cryptocurrency is experiencing pronounced bearish momentum.

Escalating inflationary risks and elevated US Treasury yields—with the 10-year yield reaching 4.6%—are driving capital away from high-beta digital assets and into defensive assets.
Market participants are increasingly pricing in potential monetary tightening, with the CME FedWatch Tool indicating a 42% probability of further interest rate hikes by March 2027.
Ethereum remains capped beneath the $2,400 resistance level while testing a critical psychological support floor at $2,000 amidst an ongoing period of structural consolidation.
Ethereum weakens amid persistent inflation risks and defensive market positioning
Global markets are exhibiting renewed concern over inflation risks and the possibility that central banks may revert to more restrictive monetary policy measures. The 10-year US Treasury yield, for instance, has reached 4.6%—its highest level in approximately one year. Concurrently, the 2-year US Treasury yield has climbed to the 4.08% zone, marking its highest point since February 2025. This environment indicates that market participants are actively pricing in potential interest rate hikes ahead of upcoming Federal Reserve decisions. Such tightening could suppress domestic consumption in the United States and pressure global central banks to elevate their own benchmark rates, within a context where inflationary pressures remain a pervasive global challenge.
According to the CME FedWatch Tool, market-implied probabilities reflect a 42% chance of an interest rate hike above the 4% threshold for the Fed's March 2027 meeting, representing the dominant consensus for this outlook. This backdrop is weighing on high-risk assets such as cryptocurrencies, as investors systematically rotate into high-quality, defensive instruments like sovereign bonds and traditional reserve currencies. Consequently, Ethereum is testing a key support zone in close proximity to the psychological barrier of $2,000, having repeatedly failed to break above the overhead resistance at $2,400.
Technical analysis of Ethereum
From a technical standpoint, Ethereum is currently navigating a consolidation pattern that denotes significant market uncertainty. Key observations include:
- Trend Context: Within a long-term framework, Ethereum continues to trade beneath its 200-day Simple Moving Average (SMA). This technical positioning reinforces the prevailing bearish sentiment. In the short term, however, price action is defined by a consolidative range that has persisted for approximately three months, reflecting a state of broader market indecision.
- Resistance Levels: Should the immediate resistance near $2,400 be breached, the primary technical ceiling is identified at $2,550, which converges with the 200-day SMA. Reclaiming these benchmarks is considered a necessary prerequisite for re-establishing a sustained bullish trajectory.
- Support Levels: If the psychological support at $2,000 is compromised, the next critical floor resides at the $1,800 mark—a vital structural support level. A sustained move beneath this threshold would likely intensify selling pressure and heighten the probability of a more profound market correction.
- Momentum Indicators: The Moving Average Convergence Divergence (MACD) is currently crossing the zero line, suggesting that downward momentum could capture further territory. Conversely, the Relative Strength Index (RSI) is approaching the oversold threshold, marking caution.
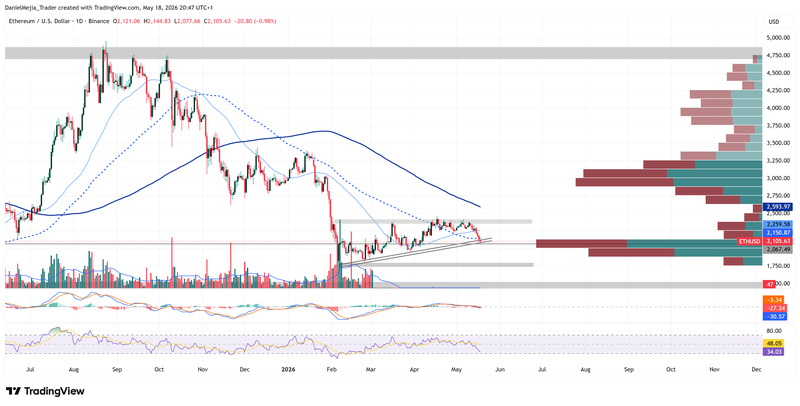
Figure 1. Ethereum Prices (2025–2026). Source: Data from the Binance Exchange; Own analysis conducted via TradingView.


