Gold weakens on hawkish Fed signals but maintains bullish trend
Gold prices have retreated marginally amidst rising expectations of a hawkish Federal Reserve policy and a resurgent US dollar increase. Despite this downward pressure, a planned US blockade of the Strait of Hormuz continues to bolster safe-haven demand.

The US plan to blockade the Strait of Hormuz, following the cessation of diplomatic talks in Pakistan, has ignited fears of global energy disruptions and potential Iranian retaliation.
Persistent high interest rates and a robust dollar continue to pressure bullion, with the CME FedWatch Tool indicating no anticipated rate cuts prior to the Federal Open Market Committee (FOMC) meeting on 28–29 April.
Gold maintains its long-term bullish structure by trading above its 100-day and 200-day Simple Moving Averages (SMAs), while neutral MACD and RSI readings suggest a period of short-term consolidation.
Gold prices retreat amid expectations of a more restrictive Federal Reserve stance
Geopolitical tensions have intensified following the White House's announcement of a planned US blockade of the Strait of Hormuz. This maritime artery is critical to global trade, facilitating the transit of approximately 20% of the world's oil, natural gas, and essential commodities. This escalation follows the collapse of diplomatic negotiations in Pakistan. The US President Donald Trump has signalled a direct maritime intervention and issue warnings regarding the destruction of Iranian vessels. In response, Tehran has stated that no port in the Middle Eastern region will remain secure should Iranian maritime interests be compromised, heightening global anxieties regarding a severe and prolonged disruption to the international energy and goods supply chain.
Consequently, gold prices experienced a marginal decline during a session characterised by heightened volatility. By the market close, bullion retreated by 0.45%, settling at $4,767 per ounce. The precious metal is currently contending with divergent market forces. On one hand, the US dollar has strengthened amidst mounting expectations of a more restrictive Federal Reserve policy; as elevated interest rates enhance the relative attractiveness of US sovereign bonds, the opportunity cost of holding non-yielding assets such as gold increases, thereby dampening demand. Conversely, bullion continues to attract robust interest from investors and hedgers seeking sanctuary amidst significant geopolitical instability and a precarious global economic environment.
According to the CME FedWatch Tool, the market consensus does not anticipate interest rate cuts ahead of the next Federal Reserve monetary policy decisions in 2026. Market participants are currently focused on the evolving US–Israel–Iran conflict, the potential duration of the Strait of Hormuz blockade, and the next Fed decision scheduled for release on 28–29 April.
Technical analysis of Gold
From a technical perspective, gold futures maintain a robust long-term bullish trajectory. A detailed analysis of the current market structure reveals several key observations:
- Trend Context: Over the long term, gold exhibits a clear market structure defined by a series of "higher highs" and "higher lows". The price is currently respecting its 100-day Simple Moving Average (SMA), confirming the underlying strength of the prevailing trend. However, short-term selling pressure is evident, driven by rising estimates of a more restrictive Federal Reserve stance.
- Resistance Levels: Should the short-term resistance at $4,850 be breached, the next significant technical ceiling is identified at the record high of $5,350. A sustained move above this level would signal a potential extension into uncharted price territory.
- Support Levels: In the event of further contraction, immediate short-term support is identified at $4,440. If this level is invalidated, the next structural floor is located at $4,190—a zone where the 200-day SMA converges with an upward trend line. A breach of the $4,190 level would notably increase the probability of a deeper market correction.
- Momentum and Volume: Both the Moving Average Convergence Divergence (MACD) and the Relative Strength Index (RSI) are currently trading in neutral zones. This suggests that the prevailing short-term trend is not yet well-defined and that fundamental factors will likely dictate the next major market movements.
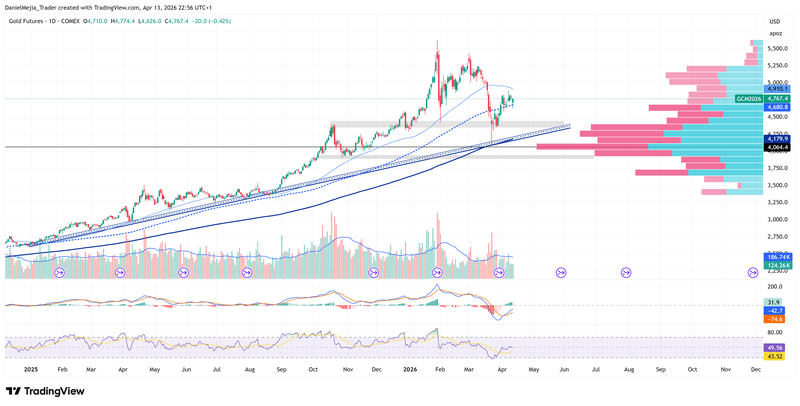
Figure 1. Gold Future Contract GCM26 (2025–2026). Source: Data from the COMEX Exchange; own analysis conducted via TradingView.


