Bitcoin retreats on failed US–Iran talks
Bitcoin fell after President Trump cancelled Iran peace talks, intensifying Middle East tensions and disrupting energy flows through the Strait of Hormuz. As oil prices surge, it is possible that investors are abandoning risky assets like crypto.

The collapse of US–Iran negotiations and the subsequent blockade of the Strait of Hormuz have driven Brent crude prices above the $100 mark, heightening global economic anxiety and risk aversion.
Bitcoin fell by 2.25%, settling at $76,888, as the escalation of regional conflict dampened appetite for speculative digital assets.
Bitcoin currently faces significant uncertainty within a consolidative phase. While the price is attempting to breach immediate resistance, technical indicators remain positioned near overbought zones, suggesting a cautious near-term outlook.
Bitcoin retreats after US–Iran talks fail, fuelling Middle East uncertainty
Over the weekend, the US administration, under President Donald Trump, took the decision to cancel a scheduled diplomatic mission to Islamabad, Pakistan, which was intended to facilitate a new round of negotiations with Iran. Consequently, the US–Israel–Iran conflict—now entering its second month of active hostilities—is generating renewed concerns regarding the potential for a prolonged energy crisis.
In a retaliatory move, Iran has maintained stringent restrictions on maritime shipments through the Strait of Hormuz. This region is a vital global artery, accounting for approximately 20% of the world’s oil and natural gas transit. This disruption has exerted significant upward pressure on energy markets; the Brent crude futures contract (BRNN6) rose 2.58% to $101.69, while the West Texas Intermediate (WTI) contract (CLM6) appreciated by 2.09% to $96.37 per barrel. Iranian officials have stated that they will not return to the negotiating table until Washington lifts the blockade on Iranian ports, which they characterise as a fundamental violation of the previous ceasefire agreement.
Bitcoin valuations have been adversely affected due to heightened geopolitical and economic volatility. Historically, such uncertainty prompts investors to exit "risk-on" markets in favour of safe-haven or defensive assets. Within this context of global instability, Bitcoin decreased by 2.25% to $76,888, even as it continues to test critical resistance levels.
Technical analysis of Bitcoin
From a technical perspective, Bitcoin has recently experienced a breach of its long-term bullish structure and is currently struggling to overcome a significant resistance zone. Key observations include:
- Trend Context: On the longer timeframes, Bitcoin continues to trade below its 200-day Simple Moving Average (SMA), a position that reinforces a prevailing bearish bias. In the short term, however, price action is characterised by a consolidative range that has persisted for roughly two months, reflecting a lack of market conviction.
- Resistance Levels: Should the immediate technical ceiling near $79,000 be breached, the next significant resistance is identified at $84,000 (which coincides with the 200-day SMA). Reclaiming these benchmarks is considered a prerequisite for re-establishing a broader bullish sentiment.
- Support Levels: If the primary support at $70,000 is compromised, the next critical floor is situated at the $62,000 mark. A sustained move below this level would likely accelerate selling pressure and increase the probability of a more profound market correction.
- Momentum Indicators: Both the Moving Average Convergence Divergence (MACD) and the Relative Strength Index (RSI) are currently trending upwards, reflecting the strength of the immediate bullish impulse. Nevertheless, both indicators are approaching overbought territory. Consequently, institutional capital flows and fundamental geopolitical catalysts are expected to remain the primary drivers of the market's trajectory.
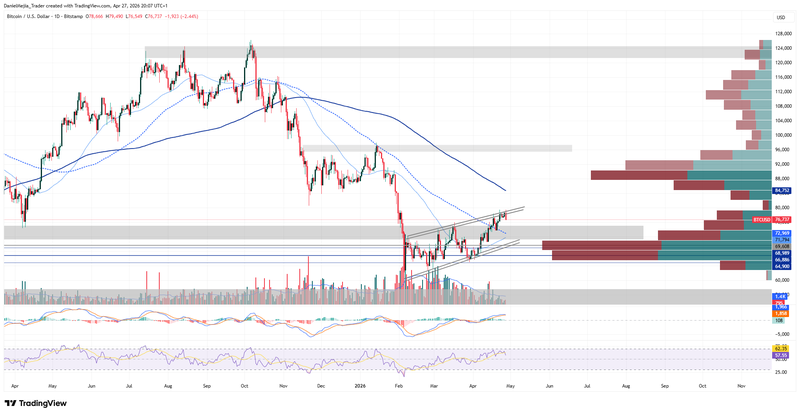
Figure 1. Bitcoin prices (2025–2026). Source: Data from the Bitstamp Exchange; Own analysis conducted via TradingView.


