Microsoft earnings, AI costs, and the profitability question
Microsoft enters earnings in a familiar position strong fundamentals, high expectations, and very little room for disappointment.

Azure growth expectations slight slowdown into the 37%–38%.
If price stay above 435, it suggests that the correction phase has ended.
Microsoft’s between quantum positioning and AI strength
Microsoft enters earnings in a familiar position strong fundamentals, high expectations, and very little room for disappointment.
The company’s latest unveiling of Majorana 1, its first quantum chip built on topological qubits, reinforces that broader narrative. This is not an immediate revenue driver, but it matters strategically. Quantum computing has long faced one central problem error correction.
Microsoft’s topological design aims to solve part of that by engineering qubits that are structurally more resistant to errors, moving the industry closer to practical quantum reliability, that matters because it strengthens Microsoft’s position beyond AI and cloud into what could become the next computing cycle.
Tomorrow’s report will be about azure
Azure grew 39% last quarter, a number strong enough to reinforce Microsoft’s leadership in enterprise AI infrastructure. But management guided for a slight slowdown into the 37%–38% range this quarter. Under normal conditions, that would still be exceptional growth. The problem is that Microsoft is no longer being priced on strong it is being priced on acceleration.
At current valuations, simply beating estimates may not be enough. The market is increasingly looking for Azure growth closer to 40% or above to justify the premium multiple and sustain momentum. Anything closer to guidance could be interpreted not as weakness but as normalization, and normalization tends to compress expectations.
Bigger pressure point sits in margins
Microsoft Cloud gross margin is guided around 65%, but that number has become more sensitive as AI infrastructure spending scales aggressively. Building AI capacity requires enormous capital expenditure data centers, chips, cooling systems, and networking infrastructure. Those costs hit margins before revenue fully catches up.
AI is driving demand, but it is also raising the cost base
Markets had already reacted sharply to that reality last quarter, when Microsoft delivered a beat but still saw a 9.8% after-hours decline as investors focused on margin compression rather than revenue strength. That reaction matters because it reset how the market interprets earnings.
Growth alone is not enough
Microsoft has to prove that AI monetization is scaling fast enough to offset infrastructure intensity. If Azure growth remains near 39%–40% while cloud margins stabilize, the market will likely view that as confirmation that the AI spending cycle is translating into profitable expansion.
But if growth slows toward the lower end of guidance while margins compress further, the stock becomes vulnerable, the broader question is no longer whether Microsoft is winning in AI, it is whether the economics of winning are becoming more expensive than the market is comfortable underwriting because for Microsoft, the story is no longer about growth leadership it is about proving that leadership can remain profitable at scale.
Technical outlook
Microsoft remains in a bullish long-term trend, but the price now shows a bounce from the low after a long correction phase. Price is currently trading around 427–429, recovering sharply from the recent low near 345, which aligns with both the ascending trendline and a major psychological support zone. That reaction is important because it confirms that long-term buyers defended trend support aggressively, preserving the broader bullish structure rather than allowing a full trend break. The rebound from 345 back toward the 430 zone reflects renewed confidence, but the stock is now approaching an important resistance cluster that will determine whether this recovery becomes continuation or simply a relief rally.
The first resistance area at at 435–436, which aligns with the 126-day moving average. This area matters because it represents the first major supply barrier after the correction. A break above 436 would strengthen the recovery structure and shift focus toward 480–500, where the price previously consolidated before the final leg into its highs. Above that, the major long-term resistance remains at 555, the prior cycle peak and the key historical supply zone. That level defines the upper boundary of the broader bullish cycle.
On the downside, the first support remains at 400–405, which is now the short-term breakout base formed during the rebound. Holding above this zone keeps the recovery constructive and signals that buyers are maintaining control. Below that, the more important support remains at 345–360, where the trendline and horizontal structural floor converge. This is the core trend integrity zone. A break below it would materially weaken the bullish structure and increase the probability of a broader corrective phase toward 320–330.
If price manages to stay above 435, it suggests that the correction phase has ended and the market is transitioning back into expansion, with upside potential toward 480 initially and possibly the 555 high over time. However, if price fails to clear this resistance and rotates lower, especially below 400, the market may enter a broader consolidation range between 345–435, delaying any fresh breakout attempt. Overall, the broader trend remains constructive, but the recovery is now approaching a decisive technical zone where momentum must translate into sustained acceptance for the bullish structure to fully reassert itself.
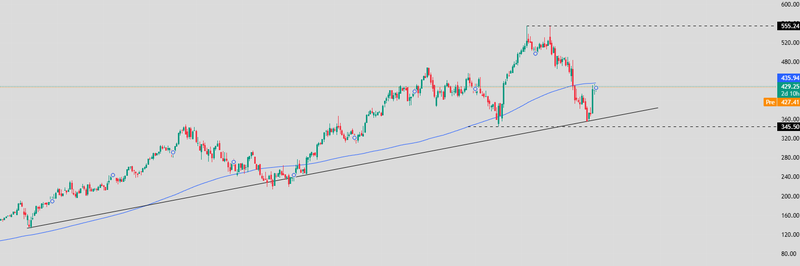
Source: Trading View


