AI inference demand rewrites Intel story
Intel’s move was not just an earnings reaction; it was a repricing of a narrative that the market had largely discounted. The 20% surge came after Q1 revenue printed at $13.6 billion, beating expectations by a wide margin.

Intel is framing this as a renaissance in CPU demand.
Price-to-book of 2.8 places the stock in the 98th percentile relative to its own history.
Probability of near-term profit-taking increases.
CPUs back in play
Intel’s move was not just an earnings reaction; it was a repricing of a narrative that the market had largely discounted.
The 20% surge came after Q1 revenue printed at $13.6 billion, beating expectations by a wide margin. A 7% year-on-year increase on its own would not normally justify that kind of move. What changed was the quality of the growth… and more importantly, the signal about where it is coming from.
The company is framing this as a renaissance in CPU demand, specifically tied to AI inference. That distinction matters. The market has been focused almost entirely on training workloads, where NVIDIA has dominated through GPUs. Inference is different, it is the phase where models are deployed at scale, embedded into applications, and run continuously. That layer is more distributed, more cost-sensitive, and structurally better suited to CPUs in many use cases.
The foundry story is becoming tangible
Intel, being named the lead foundry partner for Elon Musk’s venture, changes the perception of its manufacturing roadmap. The involvement of entities like SpaceX, Tesla, and xAI is not just symbolic. It ties Intel’s 14A process node to one of the most aggressive AI infrastructure buildouts currently being planned.
That matters because Intel’s foundry ambitions have always faced a credibility gap. Competing with TSMC requires not just technology but trust long-term contracts and ecosystem integration.
The valuation is where the tension sits
The move, however, has pushed valuation into historically stretched territory.
A price-to-book of 2.8 places the stock in the 98th percentile relative to its own history, with only about 25% of the past five years spent at similar levels. The median sits closer to 1.5, which highlights how aggressively expectations have been repriced, that matters because the market is no longer just reacting to improved results it is pricing in execution.
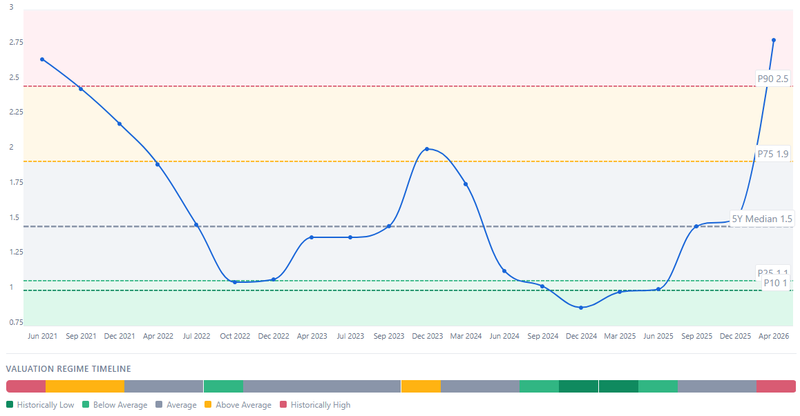
Source: Fullratio
What the market is really pricing
The stock has cleared a major multi-year resistance zone near $70 and surged pre-market by roughly 28% into the $85.70 area, marking a new all-time high. This is not just a continuation move… it is a structural shift. Price is now trading decisively above the $66 region and its key moving averages, confirming that the long-term trend has transitioned from range-bound to expansion.
That matters because breakouts from multi-decade resistance zones tend to carry different behavior. Once supply at those levels is absorbed, the market often enters a phase where price discovery replaces mean reversion. In that environment, momentum can extend further than expected, especially when supported by strong narrative and positioning. After such an aggressive repricing, the probability of near-term profit-taking increases. Investors who have participated in the move from lower levels are now sitting on significant gains, and that typically leads to partial de-risking. This does not invalidate the trend, but it can introduce a correction phase within it.
The first level to watch sits around the $69 zone, which represents the prior resistance area. That level now carries psychological and structural importance. If price pulls back into that region and holds, it will signal acceptance of the breakout and reinforce the idea that the market is building a higher base.
If, however, the stock fails to sustain above that zone, the correction could extend further toward the $51.40 area, the origin of the most recent rally. A move of that magnitude would not necessarily break the long-term structure, but it would indicate that the breakout phase moved ahead of underlying positioning and needed a deeper reset.
Options positioning
The current put/call ratio sits around 1.13, reflecting a bearish skew in contract volume. This does not necessarily imply outright bearish conviction… it is more consistent with hedging behavior. After a sharp rally, investors tend to increase put exposure to protect gains, which can amplify short-term downside pressure if the move begins to reverse.
At the same time, there is a significant concentration of open interest around the $80 strike, with approximately 224,800 contracts across various expiries. That level acts as a positioning “magnet” in the short term. With the stock trading above $80, many of these calls are deep in the money, suggesting that traders are actively rolling in higher positions to maintain upside exposure.
A high concentration of open interest at a key strike can lead to “pinning” behavior or even a gamma-driven extension. As price approaches or holds above that level, market makers may need to buy underlying shares to hedge their exposure, which can reinforce upward momentum and limit the depth of pullbacks.
This interaction between profit-taking pressure and options-driven support is what defines the current phase, on one side, the breakout invites continuation and trend-following flows. On the other, the magnitude of the move invites hedging and rebalancing. The result is typically not an immediate reversal. but a more volatile consolidation where both forces interact.
The breakout above long-term resistance confirms a transition into an expansion phase, but the speed of the move suggests that the path forward is unlikely to be linear. Whether the stock consolidates above former resistance or rotates deeper toward prior support will determine how sustainable this new trend becomes.
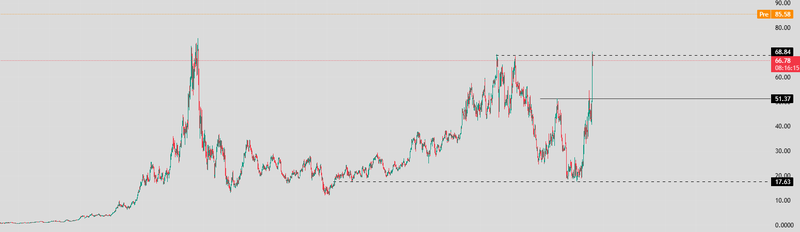
Source: Trading View


