Nvidia shares slip despite strong Q1 revenue growth and solid Q2 outlook
Nvidia Corporation’s shares declined by 1.77% to close at $219.51, despite the company exceeding first-quarter fiscal expectations with $81.61 billion in revenue and earnings per share (EPS) of $1.87. Alongside these robust financial results, the semiconductor giant demonstrated significant year-on-year growth and announced a substantial $80 billion shares buyback program.

Nvidia recorded $81.61 billion in revenue—marking 85% year-on-year growth—and an EPS of $1.87, outperforming analyst consensus estimates while providing a strong revenue outlook for the second quarter.
The company announced an $80 billion stock repurchase program, which emphasizes its aggressive capital return framework.
Although Nvidia’s shares maintain a solid long-term bullish trajectory, trading comfortably above its 50-day, 100-day, and 200-day moving averages, momentum oscillators signal a potential short-term retracement or consolidation phase.
Nvidia reports prominent YoY growth in revenue and EPS alongside solid Q2 outlook
Nvidia Corporation’s shares retreated by 1.77% to settle at $219.51 at the market close, experiencing a minor setback despite delivering solid first-quarter earnings results and an optimistic second-quarter perspective.The company surpassed analyst expectations for both total revenue and earnings per share (EPS) in its Q1 financial statement. The semiconductor leader achieved revenue of $81.61 billion, slightly ahead of the wall street consensus forecast of $78.91 billion. Concurrently, Nvidia reported an EPS of $1.87, beating the estimated $1.75.
These figures represent a remarkable year-on-year (YoY) growth rate of 85% in total revenue and a 123% YoY surge in EPS. In addition to the strong quarterly report, Nvidia forecasted second-quarter revenue above market expectations and announced a massive $80 billion share repurchase scheme—as reported by Reuters.
The trend illustrated in Figure 1 highlights a prominent, steep expansion in revenue and net income, a trajectory established primarily since Q1 2023. Nvidia’s annualized revenue growth rate has consistently remained above 50% and has strengthened significantly since Q2 2025 to reach its current 85%. While sustaining such elevated growth rates may present structural challenges as industry competition intensifies and market share gradually rebalances, the data suggests Nvidia’s structural dominance within the semiconductor ecosystem.
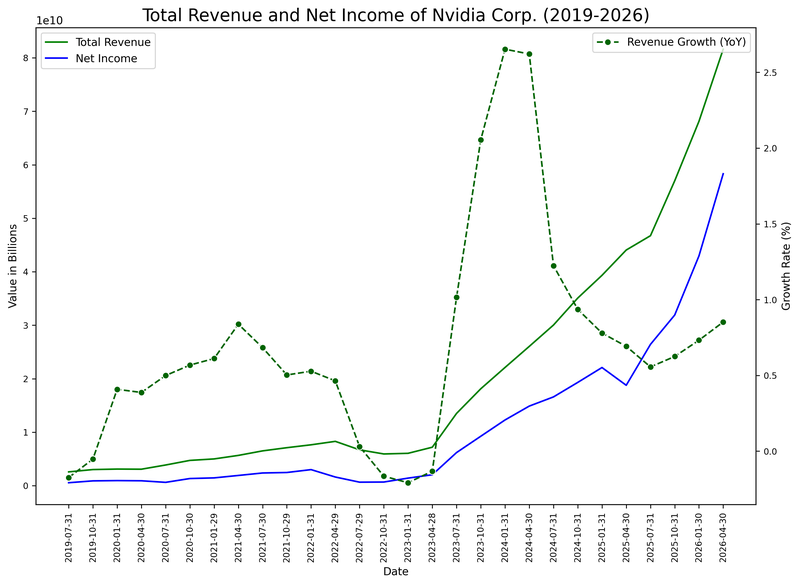
Figure 1. Nvidia’s Revenue, Net Income, and Revenue Growth Rate (2025–2026). Source: Own analysis using data from the Nasdaq Exchange.
Technical analysis of Nvidia’s share price
From a technical perspective, Nvidia's primary long-term trend remains fundamentally bullish. A closer inspection of the current market structure reveals several key nuances:
- Trend Context: Over an extended horizon, Nvidia retains a healthy bullish market structure characterized by a disciplined sequence of higher highs and higher lows. Shares continue to trade comfortably above its 50-day, 100-day, and 200-day Simple Moving Averages (SMAs). Nevertheless, short-term momentum indicators suggest caution as they trade into overbought territory.
- Resistance Levels: Should the current record high at $235 be breached, the next major technical ceiling is the key psychological milestone of $250. A decisive breakout above this level would signal a shift into a new phase of price discovery.
- Support Levels: If the immediate short-term support at $210 is invalidated, the next structural floor is identified at $190, a critical convergence zone for both the 100-day and 200-day SMAs. A breach of this $190 cushion would significantly elevate the probability of a deeper market correction, potentially targeting the secondary support cluster around $165.
- Momentum Indicators: Both the Moving Average Convergence Divergence (MACD) and the Relative Strength Index (RSI) are tracking within overbought zones, indicating that a short-term retracement or an extended consolidation phase could take place. Notably, the MACD is currently printing a bearish crossover from historically elevated levels, confirming diminishing short-term buying pressure.
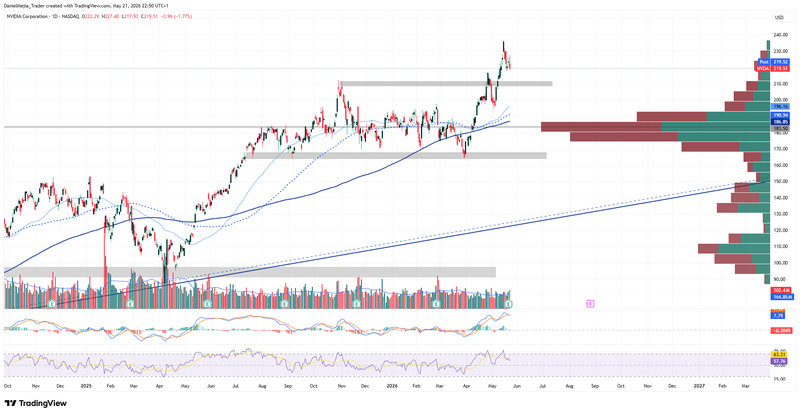
Figure 2. Nvidia’s Share Price (2025–2026). Source: Data from the Nasdaq Exchange; Own analysis conducted via TradingView.


