Mastering Fibonacci trading techniques
How to use Fibonacci trading concepts

Understanding Fibonacci sequence and ratios
Applying Fibonacci retracement levels
Utilizing Fibonacci extension levels
Who is Fibonacci?
Fibonacci is an Italian mathematician who was born in 1170 AD and died in 1250 AD. He is considered one of the mathematicians of the Middle Ages. His real name is "Leonardo of Pisa," as he was born in the Italian city of Pisa.
Fibonacci did not use the Roman numerals that were prevalent in Europe at the time, and operations such as addition, subtraction, and multiplication were impossible due to the difficulty of using those numerals. Instead, Fibonacci used Arabic numerals, which are the numbers 1, 2, 3, 4, that he learned from the Arabs. He transferred them to Europe, and they are still in use there today.
Fibonacci sequence
Fibonacci addressed many mathematical problems in his book "Liber Abaci" or "The Book of Calculation." He used a numerical sequence that he learned from the Arabs to solve one of the mathematical problems in this book. This sequence later became known as the Fibonacci sequence.
The Fibonacci sequence is a numerical sequence that starts with the number 1 and goes on infinitely. Each number in the sequence can be obtained by adding the two preceding numbers. The sequence goes as follows:
1, 2, 3, 5, 8, 13, 21, 34, 55, 89, 144, 233, 377, ….
Fibonacci Ratios
After the first seven numbers in the Fibonacci sequence, dividing each number by its preceding number produces a ratio that approaches 1.61803398, which is rounded to 1.618. There are several other ratios that can be derived from the sequence. To extract these ratios, you can start by choosing three consecutive numbers, after surpassing the first seven numbers, as shown in the following example:
144, 233, 377
Dividing 377 by the first number 144 produces a ratio of 2.618.
Dividing 233 by the preceding number 144 produces a ratio of 1.618.
Dividing 144 by the next number 233 produces a ratio of 0.618.
Dividing by the last number 377 produces a ratio of 0.382.
The most important ratios that should be known and applied to the market are as follows:
- 0.382
- 0.50
- 0.618
- 0.786
- 1.27
- 1.618
- 2.618
The application of Fibonacci ratios to financial markets dates back to Ralph Nelson Elliott, the developer of Elliott Wave Theory, who used these ratios to apply his wave theory to financial markets.
Fibonacci Price Retracement
Fibonacci retracement levels, also known as Fibonacci correction levels, are ratios of corrective price movements that are less than 100% of the previous price movement. They are used to identify areas where a correction may end and the price may resume its trend.
The most important Fibonacci ratios used in internal retracements are:
- 38.2%
- 50%
- 61.8%
- 78.6%
How to draw Fibonacci retracement:
In an uptrend:
Fibonacci retracement is drawn from the start of the movement, i.e., from the bottom to the top, with the zero at the top at the end of the movement and 100 at the bottom at the start of the movement.
In a downtrend,
Fibonacci retracement is drawn from the start of the movement, i.e., from the top to the bottom, with 100 at the top at the start of the movement and zero at the bottom at the end of the movement.
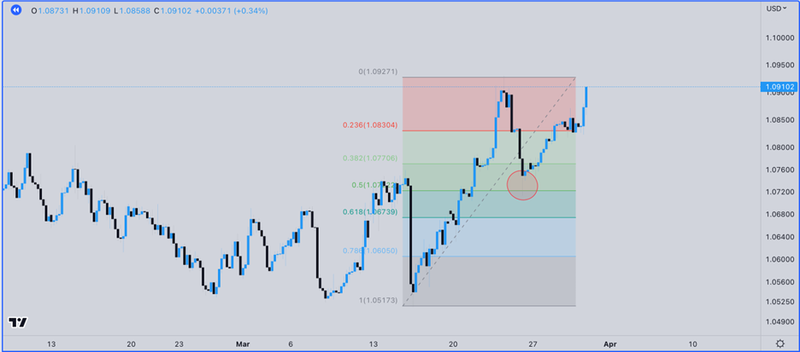
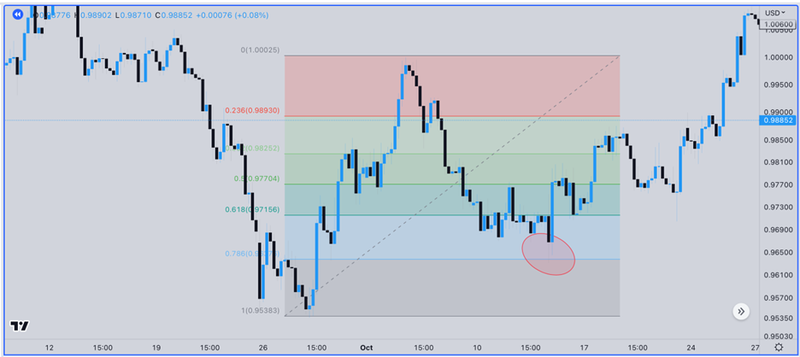
Fibonacci retracement levels in an uptrend:
Fibonacci retracement levels in an uptrend are drawn from the low of the beginning of the upward movement to the high of the end of the upward movement. The high of the end of the upward movement represents the start of the correction, and the Fibonacci ratios of 38.2%, 50.0%, 61.8%, and 78.6% are the expected Fibonacci ratios for the end of the correction.
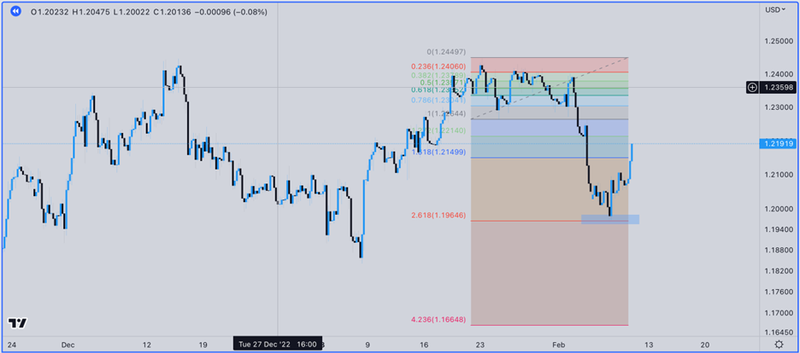
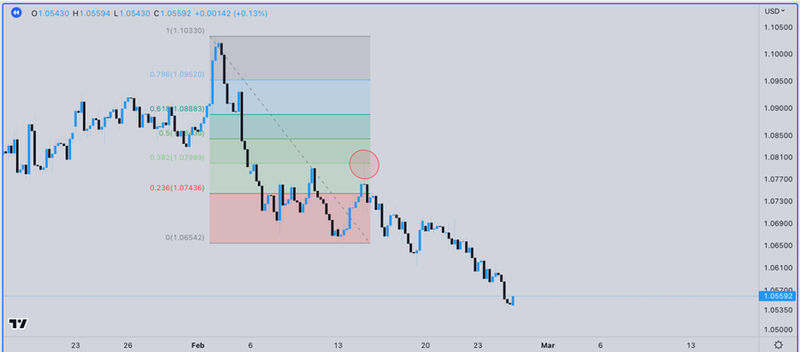
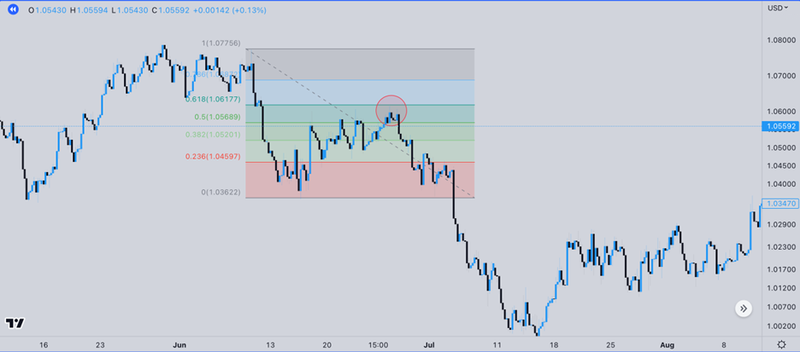
Fibonacci retracement levels in a downtrend:
Fibonacci retracement levels in a downtrend are drawn from the high of the beginning of the downward movement to the low of the end of the downward movement. The low of the end of the downward movement represents the start of the correction, and the Fibonacci ratios of 38.2%, 50.0%, 61.8%, and 78.6% are the expected Fibonacci ratios for the end of the correction.
Fibonacci Extension
Extensions are price movements that exceed 100% of the previous price movement, i.e., they are the expected price movement if the price exceeds the correction levels and resumes its previous trend without reversing.
The most important ratios for external retracements are:
- 127.2%
- 161.8%
- 261.8%
- 423.6%
Method of drawing Fibonacci extensions:
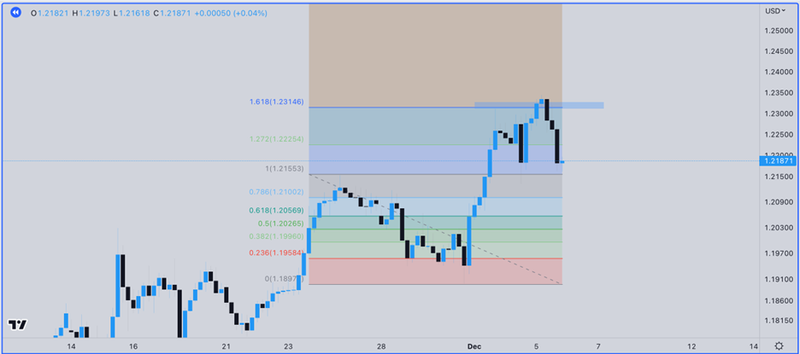
In an uptrend,
Fibonacci extensions are drawn from the end of the movement, i.e., from the top to the bottom, with 100 at the top at the end of the movement and zero at the bottom at the start of the movement.
In a downtrend,
Fibonacci extensions are drawn from the end of the movement, i.e., from the bottom to the top, with zero at the top at the start of the movement and 100 at the bottom at the end of the movement.