BoE softens proposed stablecoin rules, lifting crypto sentiment; Ethereum gains
The Bank of England relaxed proposed stablecoin rules, replacing individual holding caps with an issuance limit and increasing allowable government debt reserves to allocate.

The Bank of England dropped proposed individual holding limits for pound-denominated stablecoins and instead introduced an initial £40 billion issuance cap per stablecoin.
Stablecoin issuers will be allowed to invest up to 70% of reserve assets in short-term government debt, up from the previously proposed 60%.
Greater regulatory clarity could support the adoption of blockchain-based payments, although regulated stablecoins may also increase competition within the broader digital asset ecosystem.
Ethereum rose 0.89% to $7,727, but remains in a long-term bearish trend below its key SMAs despite improving short-term MACD and RSI momentum.
Eased BoE stablecoin proposals strengthen crypto outlook; Ethereum edges higher
According to a Reuters report, the Bank of England (BoE) has softened its proposed regulatory constraints for sterling-denominated stablecoins. The central bank has discarded its contentious plan to restrict the volume of stablecoins that individuals can hold in private wallets. Instead, policymakers have opted to manage risks by imposing a total issuance limit per stablecoin product, initially capped at £40 billion. Furthermore, the BoE relaxed its backing-asset criteria, allowing issuers to hold up to 70% of their capital reserves in short-term UK government debt securities, up from the 60% limit outlined in the previous consultation paper. The remaining 30% must be maintained in non-interest-bearing central bank deposits.
This pivot indicates a growing willingness among monetary authorities to accommodate the development of fiat-pegged digital currencies while preserving necessary safeguards for financial stability. This evolving regulatory regime could significantly enhance payment processing efficiency, stimulate financial innovation, and accelerate the broader digitisation of financial infrastructure across the United Kingdom.
Nevertheless, the immediate market reaction was limited. While increasing regulatory clarity and institutional interest in digital assets may strengthen confidence in the broader cryptocurrency ecosystem, the long-term implications are mixed. On one hand, regulated stablecoins could accelerate adoption of blockchain-based finance; on the other, they may intensify competition within the digital asset sector and reshape the role of existing crypto-native payment instruments.
Consequently, Ethereum experienced a mild boost, advancing by 0.89% to finish the trading session at $7,727.
Technical analysis of Ethereum
From a technical perspective, Ethereum continues to navigate a well-defined long-term downward trajectory. A detailed evaluation of the prevailing market structure highlights several critical observations:
- Trend Context: Within a macro-timeframe framework, Ethereum continues to trade systematically below its 50-day, 100-day, and 200-day Simple Moving Averages (SMAs). This sustained positioning beneath major moving averages confirms that institutional distribution and bearish sentiment remain the dominant forces in the market.
- Resistance Levels: Should short-term buying pressure breach the immediate psychological resistance near the $2,000 threshold to the upside, the primary technical ceiling is identified at $2,380. This level is highly significant as it converges directly with the descending 200-day SMA. Reclaiming and consolidating above this structural pivot point remains a vital prerequisite for re-establishing a valid, long-term bullish trend.
- Support Levels: Conversely, if the long-term structural support at $1,500 is invalidated, the next critical floor rests at the major $1,000 mark. This area represents a prominent psychological and historical support zone. A sustained weekly close below this threshold would likely trigger a wave of capitulation, intensify systemic selling pressure, and heighten the probability of a much deeper market correction.
- Momentum Indicators: Despite the overarching bearish trend, both the Moving Average Convergence Divergence (MACD) and the Relative Strength Index (RSI) are tracking on an upward slope. This short-term bullish divergence in momentum suggests an accumulation of underlying strength, indicating that buyers could temporarily regain control of price action to spark a potential technical rebound in the near term.
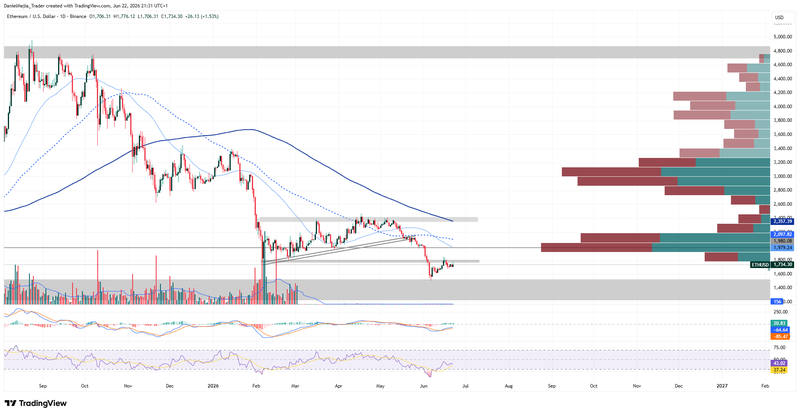
Figure 1. Ethereum Prices (2025–2026). Source: Data from the Binance Exchange; own analysis conducted via TradingView.


