Ethereum market cap pressured by US equity sell-off amid economic and AI concerns
Ethereum’s market capitalisation came under pressure as a sell-off in US technology shares, particularly semiconductor stocks, weakened risk appetite. Concerns over debt-funded AI expansion and expectations of tighter Federal Reserve policy pushed Ethereum lower.

Ethereum’s market capitalisation was hit as US technology shares, especially chip stocks, sold off amid doubts over debt-funded AI expansion.
Hawkish Federal Reserve expectations intensified risk aversion, with markets pricing a 25-basis-point September rate hike as the most likely outcome.
Ether fell by 3.76% to $1,662, while EVIV rose by 1.61% to 59.29, signalling higher implied volatility in crypto markets.
Risk-off sentiment in US stocks weighs on Ethereum amid economic and AI uncertainty
Ethereum’s market capitalisation was dragged lower by significant selling pressure in US technology stocks, particularly in the semiconductor sector, amid rising concerns over the use of debt financing to fund growth projects linked to artificial intelligence (AI).
According to a Reuters report, several technology firms have sought financing through bond markets in order to raise capital for growth projects associated with artificial intelligence. Notably, SpaceX announced its first bond issuance at the beginning of the week to raise capital, a development that contributed to a decline of around 16% in the company’s market capitalisation. As a result, market participants are expressing growing concerns about debt-funded AI investment among technology companies and its long-term sustainability.
In addition, market participants remain concerned about the possibility of a more hawkish Federal Reserve at forthcoming monetary policy meetings, a scenario that could place pressure on the broader economy. According to CME’s FedWatch Tool, implied probabilities indicate a 50% likelihood of a 25-basis-point increase at the September meeting, the highest probability in the current assessment. In turn, the implied probability that the target rate reaches 4.25% at the December meeting stands at 34%, slightly below the 36% probability that it rises to 4.0%.
Before the market close, Ethereum had fallen by 3.76% to $1,662. Cryptocurrencies have increasingly been treated as high-beta assets, as they tend to decline when volatility rises in equity markets, particularly in the US market given its global dominance. By contrast, the Ethereum Volmex Implied Volatility (EVIV) advanced by 1.61% to 59.29 points, a relatively low level that could still have scope to rise further if cryptocurrency volatility increases. The EVIV index measures the 30-day implied volatility of options linked to Ethereum.
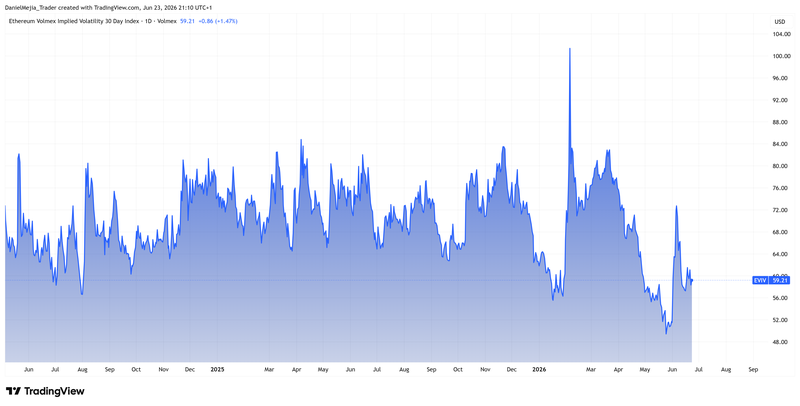
Figure 1. Ethereum Volmex Implied Volatility (2024–2026). Source: Figure obtained from TradingView.
Technical analysis of Ethereum
From a technical perspective, Ethereum maintains a clear downward trajectory. A more detailed assessment of the current market structure reveals several key observations:
- Resistance levels: Should the immediate psychological resistance near the $2,000 threshold be breached to the upside, the primary technical ceiling is identified at $2,380. Reclaiming this structural pivot point would be relevant for recovering upward momentum.
- Support levels: If the long-term structural support at $1,500 is breached, the next critical floor lies at the $1,000 mark—a prominent psychological zone. A sustained close below this threshold would likely intensify selling pressure and significantly increase the probability of a deeper market correction.
- Momentum indicators: Both the Moving Average Convergence Divergence (MACD) and the Relative Strength Index (RSI) are currently developing upward slopes, suggesting that bullish forces could regain control of price action in the short term. However, economic and geopolitical factors may continue to drive the future direction of Ethereum prices.
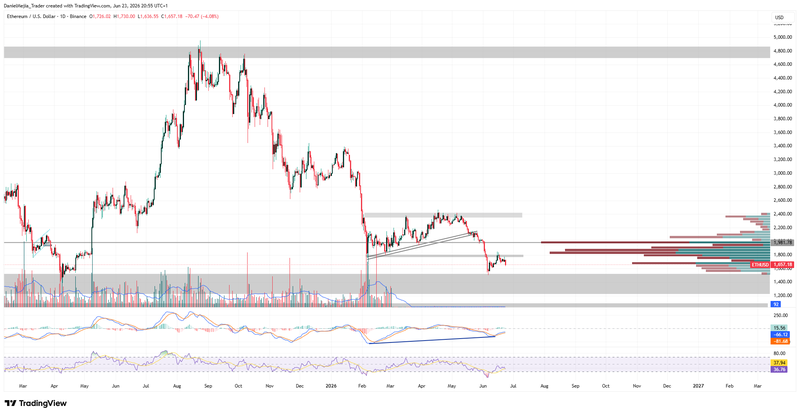
Figure 2. Ethereum Prices (2025–2026). Source: Data from the Binance Exchange; own analysis conducted via TradingView.


