Nasdaq hits record high on strong Big Tech Q1 2026 earnings
The Nasdaq is trading at record highs following a series of stellar Q1 2026 earnings reports from Alphabet, Microsoft, Amazon, and Meta. Despite technical indicators suggesting overbought conditions, robust revenue and earnings per share (EPS) growth across the "Magnificent Seven" have sustained a powerful bullish surge.

Major technology giants exceeded Q1 2026 expectations; Alphabet and Amazon, in particular, recorded substantial EPS growth.
Nasdaq futures reached a historic peak of 27,576 points, with the market now targeting the 28,000 psychological resistance level if the primary long-term bullish trend persists.
While MACD and RSI indicators confirm strong bullish momentum, their entry into overbought territory suggests the potential for a short-term market retracement or consolidation.
Alphabet, Microsoft, Amazon, and Meta report robust Q1 2026 earnings: Nasdaq reaches record highs
The Nasdaq-100 futures contract (NQM26) is trading at record levels, propelled by solid Q1 2026 earnings results from four prominent members of the "Magnificent Seven". Alphabet, Microsoft, Amazon, and Meta Platforms all surpassed analyst expectations for total revenue and earnings per share (EPS), achieving impressive year-on-year (YoY) growth rates.
Alphabet (GOOGL) reported revenue of $109.90 billion, exceeding the forecast of $106.79 billion. Furthermore, the company posted earnings per share of $5.11, significantly outperforming the estimate of $2.62. These results represent a YoY revenue growth rate of 21.8% and an exceptional 81.8% surge in EPS.
Microsoft (MSFT) achieved total revenue of $82.90 billion, surpassing the projected $81.29 billion. Additionally, the company reported EPS of $4.27, ahead of the analyst estimate of $4.05. These figures reflect a YoY revenue increase of 18.3% and a 23.4% rise in EPS.
Amazon (AMZN), the e-commerce and cloud services leader, revealed total revenue of $181.50 billion, outperforming the market consensus of $177.13 billion. The company also reported EPS of $2.78, well above the forecast of $1.63. This implies a YoY revenue growth rate of 16.6% and a remarkable 74.8% increase in EPS.
Meta Platforms (META) reached total revenue of $56.31 billion, exceeding the analyst forecast of $55.52 billion. The social media giant achieved earnings per share of $10.44, considerably higher than the $6.65 estimate. These results unveil a YoY revenue growth rate of 33% and a substantial YoY increase of 62.3% in EPS.
Technical analysis of the Nasdaq futures contract
From a technical perspective, the Nasdaq index maintains its long-term bullish trajectory. Key observations include:
- Trend Context: In the long term, the Nasdaq retains a bullish market structure characterised by a sequence of higher highs and higher lows. The index is trading comfortably above the 50, 100, and 200-day Simple Moving Averages (SMAs). In the short term, the index maintains its prevailing upward trend; however, momentum indicators—specifically the MACD and RSI—are currently trading in overbought zones.
- Resistance Levels: Should the index persist in its primary trend, the next significant target is the 28,000 threshold—a major psychological barrier. A decisive breach above this level would signal a continuation into uncharted market territory.
- Support Levels: If immediate support at 26,250 is invalidated, the next critical structural floor is located at 25,000, a level that converges with the 200-day SMA. A breach of the 25,000 zone would significantly increase the probability of a more profound market correction.
- Momentum Indicators: Both the Moving Average Convergence Divergence (MACD) and the Relative Strength Index (RSI) exhibit an upward structure, signalling the strength of the current bullish impulse. However, as both indicators are in overbought territory, they suggest a potential retracement or a consolidation phase. Despite these readings, the solid fundamentals exhibited by US technology firms could continue to drive the index’s performance higher.
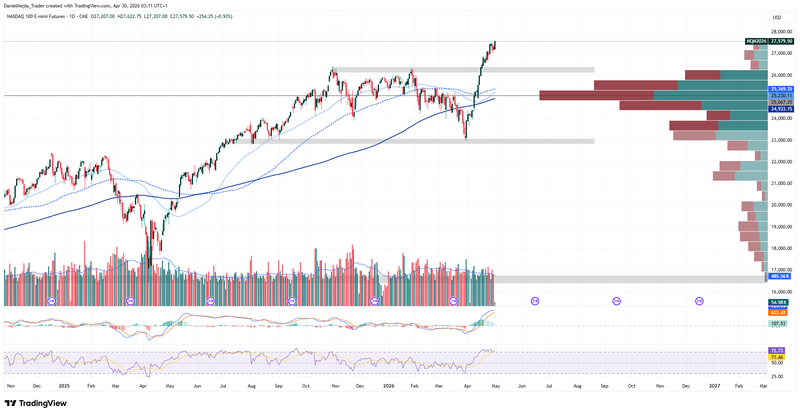
Figure 1. Nasdaq Future Contract (2025–2026). Source: Data from the CME Group; Own analysis conducted via TradingView.


